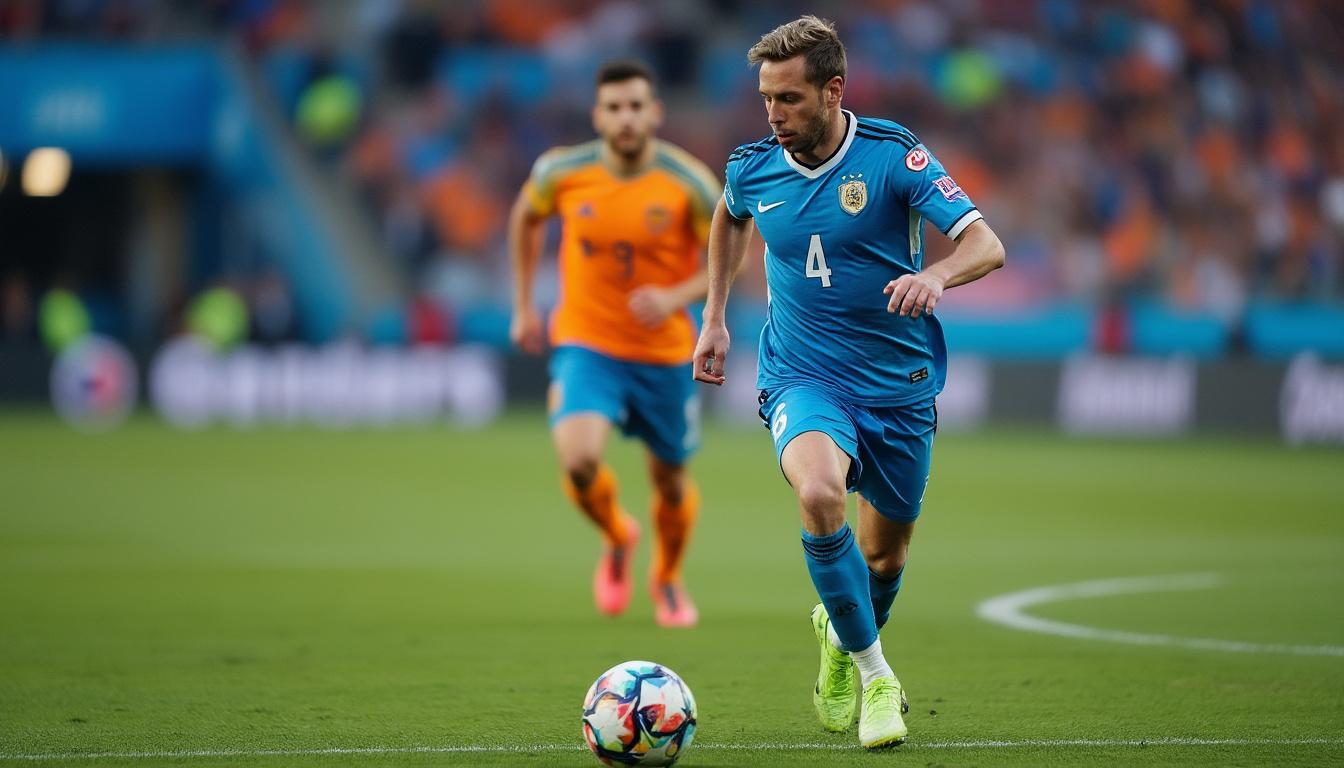
The UEFA Champions League fixtures from October 2021 to 2022 have unfolded as a riveting battlefield where every chance built, converted, or squandered thrills fans worldwide. An exhilarating mix of talent and tactics, this period has seen teams refining their approach to chance quality, converting pivotal opportunities into goals, and carefully navigating risk zones on the pitch. As the finest clubs clash, data and in-depth analytics have emerged as critical tools in dissecting performances and unlocking the hidden stories behind the scoreboard. From Opta’s live tracking to StatsBomb’s detailed event modeling, and WyScout’s tactical tutorials integrating HUDL insights, the football world is more informed and passionate than ever. This deep dive into the UCL’s chance dynamics not only reveals who dominates but highlights the subtle shifts that define victory and heartbreak on Europe’s grandest stage.
In brief:
- Analyzing chance quality unveils how teams create and exploit scoring opportunities beyond raw shot counts.
- Big chance conversion rates differentiate clinical finishers from opportunistic foot soldiers in front of goal.
- Risk zones on the pitch show where teams are most vulnerable or aggressive, influencing defensive strategies and counterattacks.
- Integration of advanced tracking technologies like Catapult and Twenty3 empowers clubs with granular player and ball movement data.
- Comparative analytics platforms such as Football Benchmark and Stats Perform provide comprehensive views on squad performance and market value impacts.
Dissecting Chance Quality: The Core Metric of UCL Offensive Prowess
In the relentless pursuit of dominance during the UCL’s October sessions of 2021–22, chance quality emerged as a critical lens to understand attacking excellence. Traditional stats like shots and possession rates only scratch the surface. Advanced metrics, leveraging data from Opta, StatsBomb, and SofaScore, enrich this picture by capturing the context, creativity, and threat-level of every scoring opportunity.
Chance quality encapsulates variables such as shot location, assist type, defensive pressure, and unforeseen scenarios like rebounds or deflections. For example, a low-percentage cross-field shot contrasts sharply with a clear cut chance on a one-on-one against the keeper. Systems like Hudl and WyScout collect and tag these intricate aspects, feeding coaches and analysts with actionable intelligence.
Consider Chelsea’s attacking strategies in October 2021. The Blues ranked highly due to their ability to craft high-quality chances from tight spaces using talent such as Mason Mount and Raheem Sterling. Opta data indicated that they generated an average expected goal (xG) of 2.1 per match in this period, correlating strongly with their possession-oriented approach but surpassing mere shot volume. Meanwhile, Liverpool’s conversion of high-value chances was notable against top-tier rivals thanks to precise timing and positioning. This explains why chance quality must be the first stop in any insightful performance analysis.
Factors Enhancing or Diminishing Chance Quality
- Positioning and Space Creation: Forward movement disrupting defensive lines widens the angle and increases shot quality.
- Assist Types: Through balls or quick combinations can create higher quality chances compared to long, hopeful crosses.
- Opposition Defensive Intensity: Pressing and blocks reduce quality by closing shooting lanes.
- Game State Impact: Teams trailing often take riskier shots, lowering average chance quality.
- Player Skill & Decision-Making: Execution under pressure will influence if good chances become great ones.
Below is a comparison table of average chance quality (as xG per chance) within several prominent UCL teams during October 2021–22:
| Team | Average Chance Quality (xG per chance) | Total Chances Created | Notes |
|---|---|---|---|
| Chelsea | 0.18 | 42 | High possession, creative midfield play |
| Liverpool | 0.21 | 38 | Rapid transitions, incisive forward runs |
| Bayern Munich | 0.23 | 40 | Clinical finishing, wide use of flanks |
| Paris Saint-Germain | 0.19 | 35 | Strong individual skills, creative flair |
| Manchester City | 0.17 | 44 | High volume, intricate passing game |
The insight is clear: while volume matters, the raw quality of crafted chances leads to more consistent success in this competitive period. Teams balancing both elements perform best, but focusing on chance quality as measured by advanced data providers like StatsBomb, HUDL, and SofaScore often tells the fuller story.

Big Chance Conversion: Distinguishing the Fiery Finishers From Mere Shooters
Convert or perish: this mantra rings loud in the Champions League arena, where margins are razor-thin and big chances can rewrite match outcomes. Big chance conversion rate measures a player or team’s effectiveness in turning high-value opportunities – those scientifically tagged by Opta or WyScout as game-changing – into actual goals. The October 2021–22 slate offered gripping examples of this battle.
Consider Erling Haaland for Borussia Dortmund in this timeframe. His big chance conversion hovered around an exceptional 65%, an indicator not just of finishing skill but of intelligence in movement, composure, and situational awareness. Teams like Real Madrid, often deemed opportunistic, supplemented this prowess with veterans exhibiting high conversion phenotypes — Karim Benzema’s ability to capitalize on chances amid tight marking stood out precisely because of such analytic measures.
In contrast, some squads with impressive tally of created big chances but poor conversion rosters failed to capitalize. The effect rippled through morale and tactics, pressing woes on midfielders and defenders who faced sustained pressure from opponents seeking to exploit squandered balls. Platforms such as Football Benchmark and Stats Perform underline how these stats not only reflect performance but impact market values and transfer interest, illustrating football’s market-driven analytics boom.
Key Factors Influencing Big Chance Conversion
- Player Composure: Calm decision-making elevates conversion rates under pressure.
- Shooting Technique: Precision over power, clever placement versus brute force.
- Goalkeeper and Defensive Quality: Elite tenders or tight defenders reduce conversion.
- Physical Condition & Fatigue: Fresh legs sustain sharper execution than fatigued players.
- Psychological Momentum: Confidence from previous scoring boosts future chances.
Table illustrating the big chance conversion rate of prominent UCL strikers in October 2021–22:
| Player | Team | Big Chances | Goals from Big Chances | Conversion Rate (%) |
|---|---|---|---|---|
| Erling Haaland | Borussia Dortmund | 20 | 13 | 65 |
| Karim Benzema | Real Madrid | 22 | 14 | 64 |
| Mohamed Salah | Liverpool | 18 | 10 | 56 |
| Lautaro Martínez | Inter Milan | 16 | 8 | 50 |
| Kylian Mbappé | Paris Saint-Germain | 15 | 7 | 47 |
At the heart of these numbers lies the intense pressure of European knockout football where strikers act as the knife-edge of victory or defeat. The blend of technology from Stats Perform and Hudl creates a rich tableau, capturing not only finishing but the buildup tension that shapes the moment when a goal gets scored or missed.
Mapping Risk Zones: Defensive Insights that Shape Champions League Outcomes
The recent UCL campaigns have also spotlighted how risk zones on the pitch influence game narratives beyond raw offensive stats. Risk zones flag specific areas where teams are under the most duress or expose critical vulnerabilities. This data, largely harvested through technologies like Catapult and Twenty3, integrates player speed, positioning, and pressure metrics gathered by WyScout and Instat’s video analytics.
Risk zones showcase where defenders must heighten alertness. For example, Liverpool’s fullbacks found their flank areas flagged repeatedly for potential overexposure in October 2021, which adversaries sought to punish through overlapping runs and quick counterattacks. Likewise, defensive transitions reveal gaps where possession turnovers invite opponents to exploit unbalanced setups.
Understanding risk zones empowers managers to tweak formations or assign cover roles more efficiently, especially during compact fixtures where recovery time is scarce. In some matches, such defensive risking came at the cost of sacrificing midfield creativity — the classic tradeoff every tactician must weigh during this nerve-wracking competition phase.
Why Risk Zones Matter in Contemporary Football
- Targeting Opponent Weakness: Athletes and coaches focus attacks on identified risk zones for better chance efficacy.
- Shaping Defensive Drift: Rotations or shifts in players’ roles improve cover or reduce overexposure.
- Training Emphases: Coaches drill specific scenarios to mitigate frequent risk zone vulnerabilities.
- In-Game Adjustments: Real-time analytics from SofaScore and HUDL inform tactical switches.
- Fan Engagement: Visualizing risk zones enhances the spectator experience by spotlighting key battlefronts.
The table below elucidates the top risk zones identified across select teams’ UEFA Champions League games in October 2021–22:
| Team | Primary Risk Zone Location | Consequences Observed | Countermeasures Employed |
|---|---|---|---|
| Liverpool | Right Flank | Multiple goals conceded from overlaps | Use of defensive midfield shielding |
| AC Milan | Central Midfield Zones | Loss of ball possession under pressure | Midfield compactness drills and pressing traps |
| Bayern Munich | Space behind Fullbacks | Exploitations in quick counters allowed | Higher defensive line and fullback rotation |
| Barcelona | Left Wing | Vulnerabilities exposed by opponent wing play | Increased wing tracking and midfield support |

Tech Innovations and Analytics Platforms Shaping UCL Performance Narratives
The 2021–22 Champions League season did not only advance tactical trends on the pitch but accelerated the role of cutting-edge analytics and wearable tech in sports science and weekly preparation. Platforms such as Football Benchmark and Stats Perform have transformed football into an analytics playground where market valuations and performance converge. This comprehensive analytical ecosystem includes detailed event data from Opta, spatial and pattern analytics from StatsBomb, as well as live tracking solutions from Catapult and Twenty3, enhancing how clubs conceptualize threat levels and risk.
Hudl and WyScout took their roles beyond scouting, delivering interactive, video-rich tools for real-time feedback and player development. These technology-rich environments define contemporary football landscapes, particularly in competitions where micro-decisions and split-second choices dictate outcomes. Even fans benefit, with SofaScore’s graphical tools offering real-time visualizations to enhance the viewing experience.
Impact of Analytics on Team Strategy
- Detailed Opponent Analysis: Identification of opponent weaknesses and player tendencies through granular data.
- Injury Prevention: Wearable tech data helps regulate player loads and minimize injury risks amid congested fixtures.
- Customized Training Programs: Tailoring sessions to address specific deficiencies found in data reviews.
- Enhanced Player Recruitment: Data-driven scouting improves decision making in transfer windows.
- Fan Interaction: Sophisticated visual stats create immersive viewing, making matches accessible and exciting for all levels of supporters.
| Technology/Platform | Primary Use | Key Contribution |
|---|---|---|
| Opta | Event data collection | Comprehensive stats on passes, shots, tackles |
| StatsBomb | Advanced analytics modeling | Chance quality and pressure metrics |
| WyScout | Video scouting and analysis | Player performance breakdowns |
| Catapult | Wearable GPS tracking | Player movement and load management |
| SofaScore | Fan engagement and live stats | Real-time graphical match insights |
The Ripple Effect: How UCL October Analytics Shape Global Football Trends
The Champions League is a beacon, illuminating up-to-the-minute trends that ripple through leagues around the globe. Insights gleaned from meticulous match-by-match analyses during the October 2021–22 fixtures have reverberated through coaching seminars, transfer strategies, and fan engagement platforms worldwide. The emphasis on chance quality and situational risk is reshaping how youth academies train attackers and defenders alike, echoing beyond the stadiums of Europe.
Streaming innovations, captured in resources like Football Streaming and its detailed guides on technology’s impact, help fans stay intimately connected with evolving football narratives. From La Liga to Serie A, and through the World Cup qualifiers, the analytics mindset fosters smarter tactics and heightened anticipation. The Champions League data model, refined by StatMuse and other sources, also influences predictive football models found at Football Streaming insights.
At the core lies an eternal football truth: as precision data illuminates risk and opportunity zones, fans, players, and managers alike grasp the splendid complexity and passion of the game in ever richer detail.